UNSDG 13:
Climate Action
Research Centric Case Study | Design for Sustainability | Infographic Design
Role: Research, Infographic Design, Strategy
Timeline: January to March 2025 (10 Weeks)
Mentor: Tom Hardy (Design Management Professor at SCAD)
Tools: Figma, Illustrator
Context: A course within the MFA in Design for Sustainability curriculum; I explored UN SDG 13 (Climate Action) and by extention three of the most interconnected to analyse its targets and proposals to create a visual infographic that best describes the four SDGs and their impacts in different industries and situations.

Goal
Take urgent action to combat climate change and its impacts
Issues to tackle
1. Global sea level and temperature rise due to industrial practices and greenhouse gas (GhG) emissions
2. Increased frequency and intensity of extreme weather events

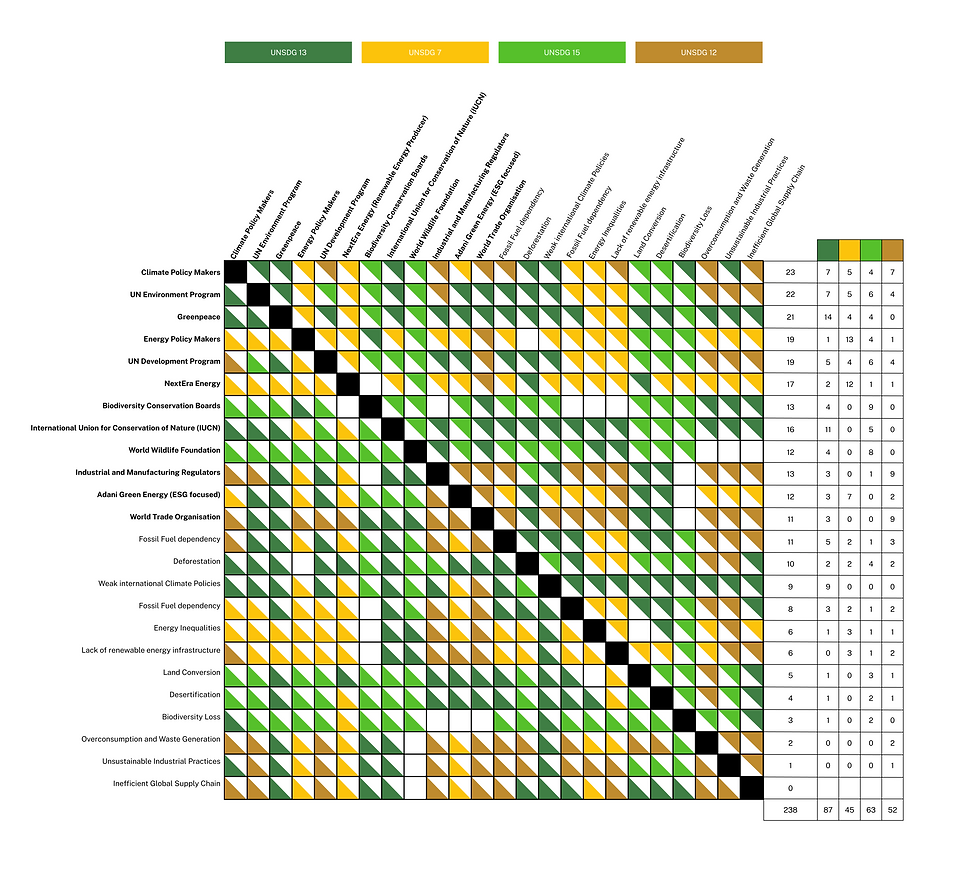
The visual Infographic below is a table cross referencing different agents and organisations (identical on x and y axis) with the reference blocks indicating their compatibility and which of the four highlighted UNSDGs would be best suited to develop an intervention. This table tallies and helps understand the relationships between the SDGs.
The visual Infographic below contains a series of research areas and considerations including most impactful negative and positive agents (organisations or individuals), categorisations (private or state funded industries and fields), STEEP ranking (social, technological, economic, environmental, political), and the three pillars (people, profit, planet).

